VIX bottom in 2017 – followed by a break outside bullish ending diagonal
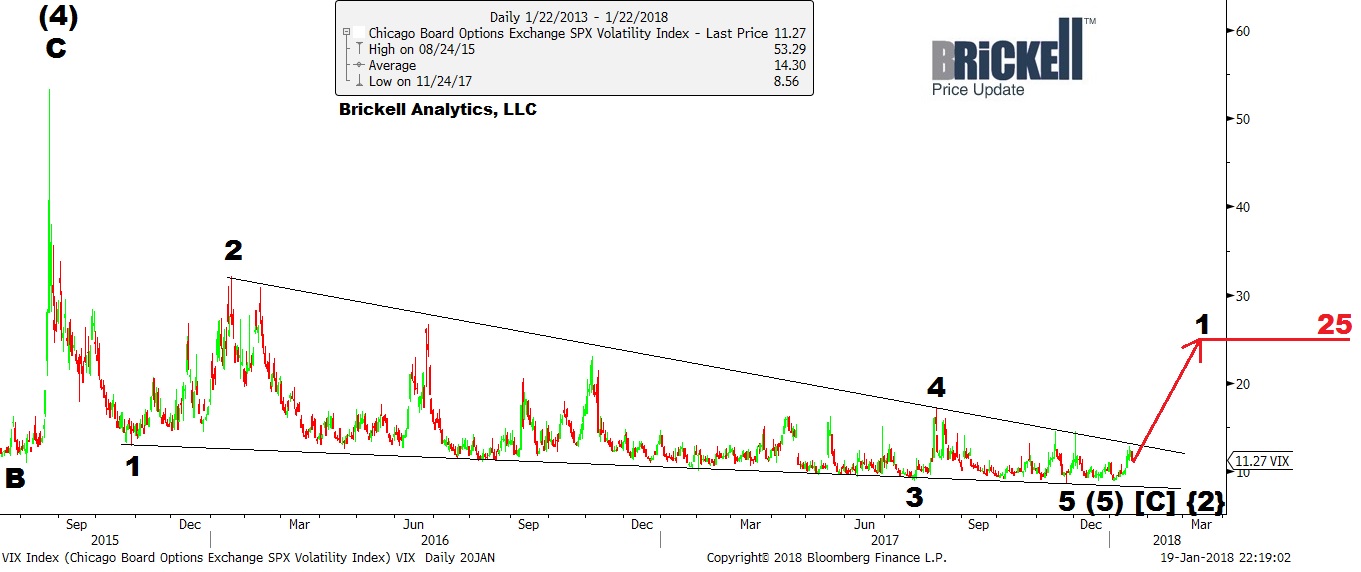
Since the 53.29 August 24, 2015 multi-year high, the VIX has been forming a bullish falling wedge pattern or ending diagonal. An ending diagonal chart pattern signals a reversal in trend. Once the pattern completes, the falling wedge guarantees a movement in price from down to up with a sharp spike outside of the wedge. The wedge formation is a highly reliable technical pattern. Over the last six months, VIX selling pressure has been waning around the 8.50 support level and the VIX could have finally bottomed at 8.56 on Nov. 24, 2017. If indeed the VIX bottomed at 8.56, it should start to surge in wave 1 up to 25 from yesterday’s 11.27 closing price
On mobile, view chart on landscape.![]()
Connect with Us