Was the Post-Election Rally in the SPX in 2016 Visible?
November 5, 2016 | Brickell Analytics
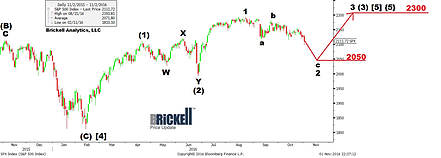
On November 5, 2016, we made the following forecast: The SPX is on the verge of a BIG rally, regardless of who is elected president. The rally should start no late than Wed.m Nov. 9. The SPX should bottom between 2083.79, yesterday’s intra-day low, and 2050, and then,…
Was the crash in the SPX in the summer of 2015 Visible?
August 12, 2015 | Brickell Analytics

On August 12, 2015, we made the following forecast: The SPX should stage an approximate 15% mini-crash to 1750, over the next few days. To confirm the mini-crash, the SPX must decline below 2044.02, the July 7 low, as per the chart below.
Forecast on the 10-yr Treasury Note
June 21, 2013 | Brickell Analytics
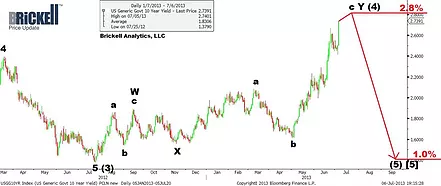
The 10-yr treasury yield is in wave C of Y of (4) up of [5] down. The upside target for wave (4) is 2.8%. The downside target for wave (5) of [5] is 1.0%.
Was the Oil Crash in 2014 Visible
June 21, 2014 | Brickell Analytics
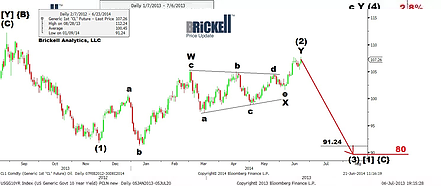
On July 21, 2014, the day after oil hit 107.73, we made the following forecast: Oil may have topped at 107.73 and started wave (3) of [1] of {C} down. The downside target for wave (3) of [1] of {C} is 80, with support at 91.24.
Was the Decline in the AUD Visible
April 11, 2013 | Brickell Analytics
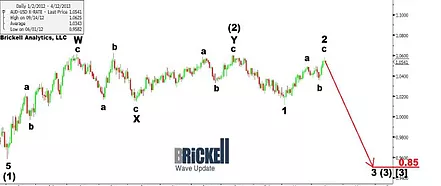
At 11:41 PM on April 11, 2013, we made the following forecast: The AUD-USD may have topped today at 1.0582. The AUD has been overbought for more than one year. This currency should become one of the biggest losers. The AUD-USD is starting wave 3 or (3) of [3] down. Th…
Was the Oil Crash in 2014 Visible
October 5, 2012 | Brickell Analytics
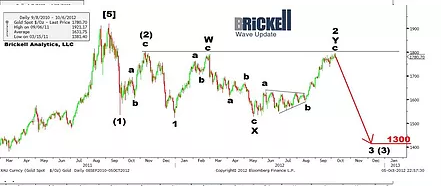
On October 5, 2012, the day gold closed at 1780.70, we made the following forecast: Gold had 9 months of “respite,” a brief period of rest and recovery, to relieve last year’s oversold condition: it rallied 18% from 1522.75 to 1796.08. Gold is now overbought and ready t…
Connect with Us