Bitcoin Top in 2017
On Dec. 10, 2017, seven days before bitcoin hit its 19511 all-time high, we made the following forecast:
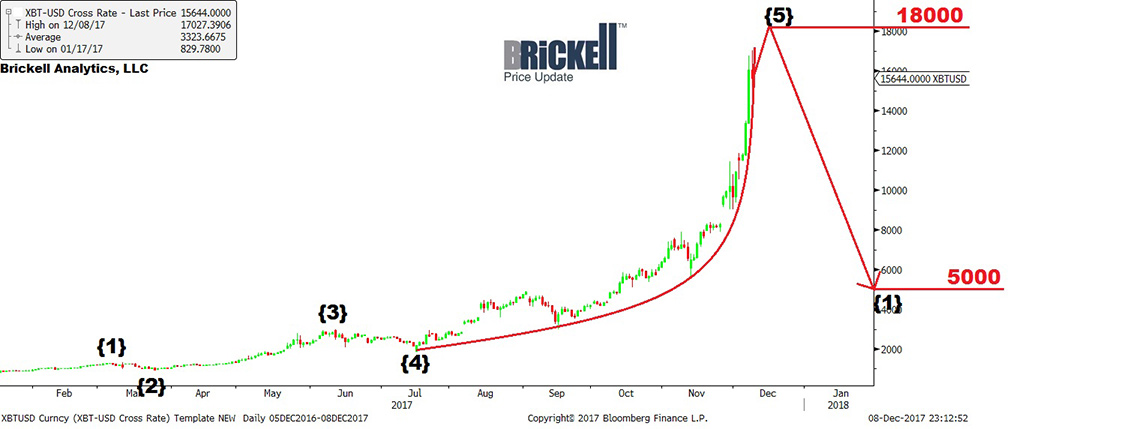
In mathematics, a curve that turns into a vertical line as it heads towards infinity is called a vertical asymptote. The slope of a vertical asymptote is undefined as the denominator is equal to 0. The chart of bitcoin looks like a vertical asymptote, and in finance, vertical asymptotes are not sustainable and precede crashes. Bitcoin’s rise could be capped at 18,000; it should then reverse and collapse about 72%.
The XBT-USD is in wave {5} up. The upside target for wave {5} is 18000. The downside target for wave {1} is 5000.
On mobile, view chart on landscape.![]()
Connect with Us